

Analysis Dataset of an E-commerce Platform
DA Side Hustle Portfolio Bootcamp 20


This is the Data Analytics Portfolio Bootcamp Group 20 with side hustle group. A team of young vibrant enthusiastic IT data analytics seeking ways to help improve and provide quality data for the business world at large.
Introduction This is a Report on the monthly Data of an E-commerce Platform between Feb-March 2021(4 months)Dataset.
link to google drive for comprehensive details: drive.google.com/drive/folders/1P5djN-kJmrK..
TITLE: E-commerce Dataset.
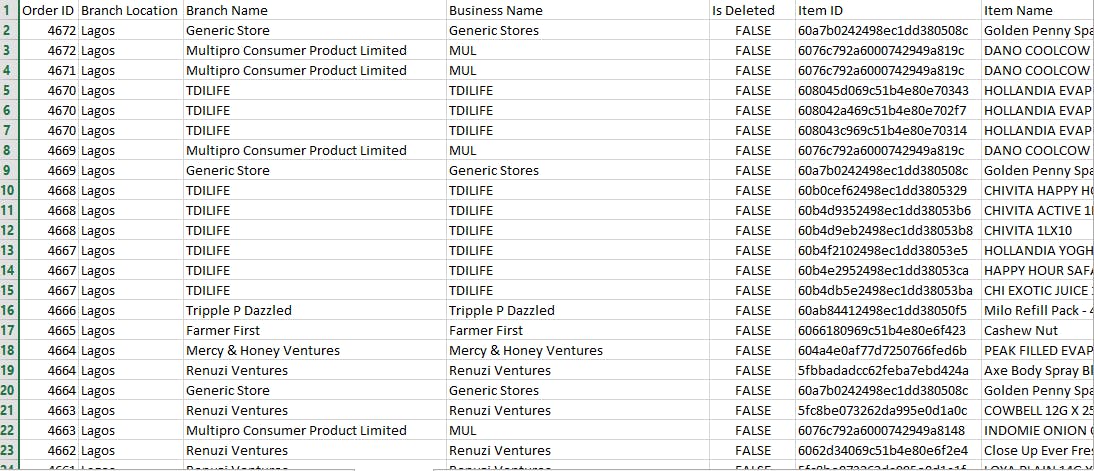
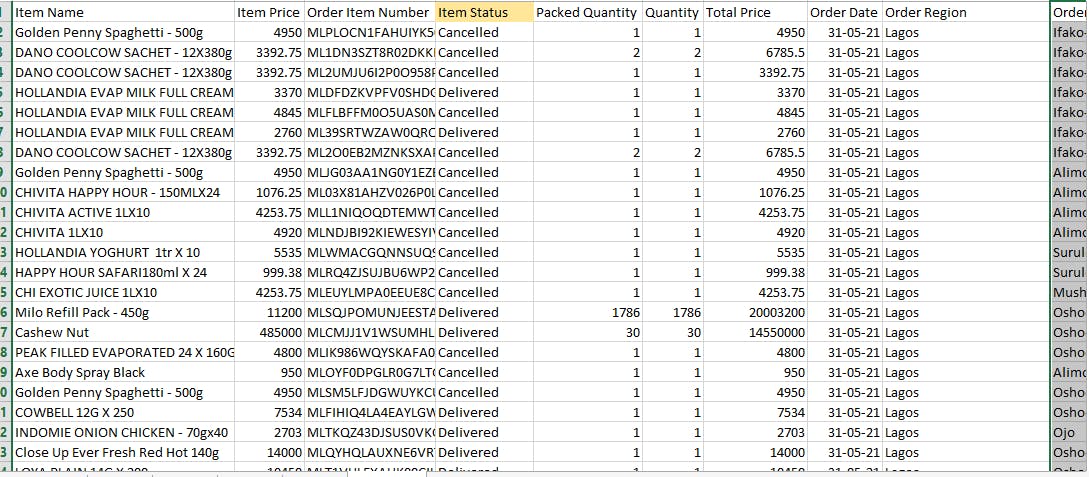
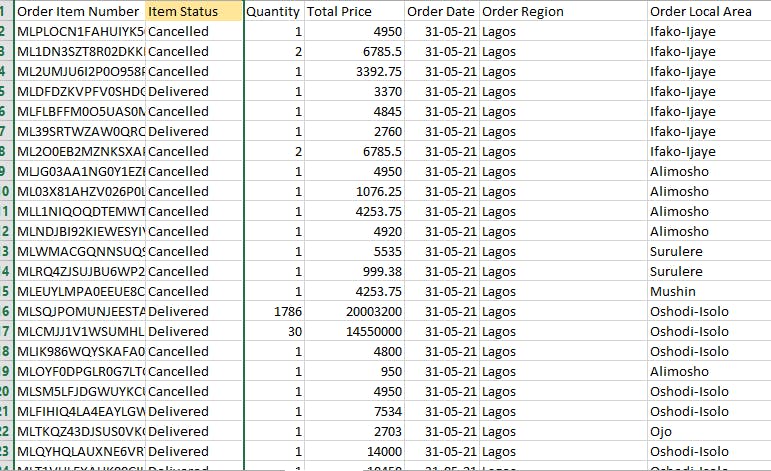
SOURCE: kaggle, Nigeria Dataset. Links to our Hashnode and Google Drive.... Picture of our raw data
A view of Raw Dateset:
TOOLS/PLATFORM used: Power BI and Excel.
Cleaning process: Data cleaning with Excel and PowerBI
- Replaced null values
- To ensure some level of granularity, irrelevant columns were removed.
- Removed duplicates.
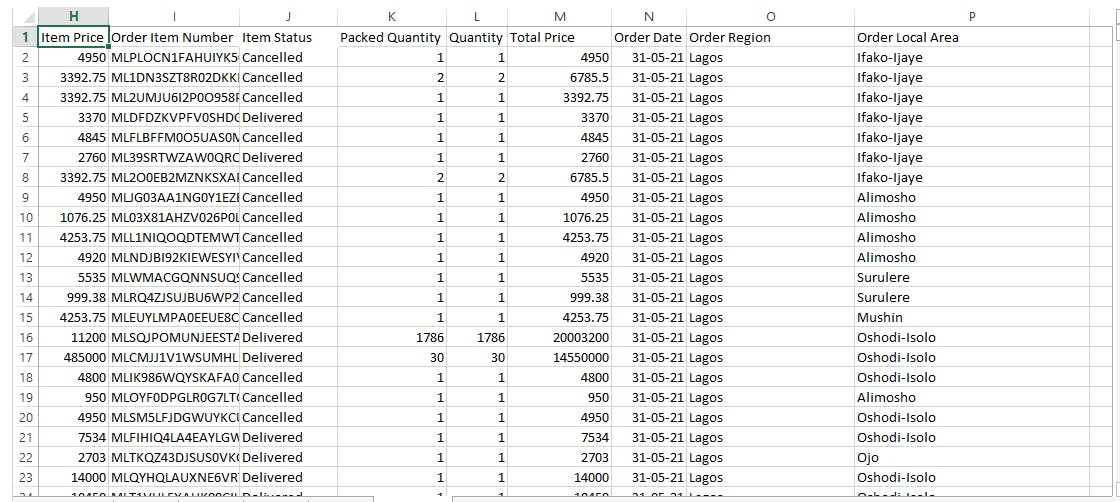
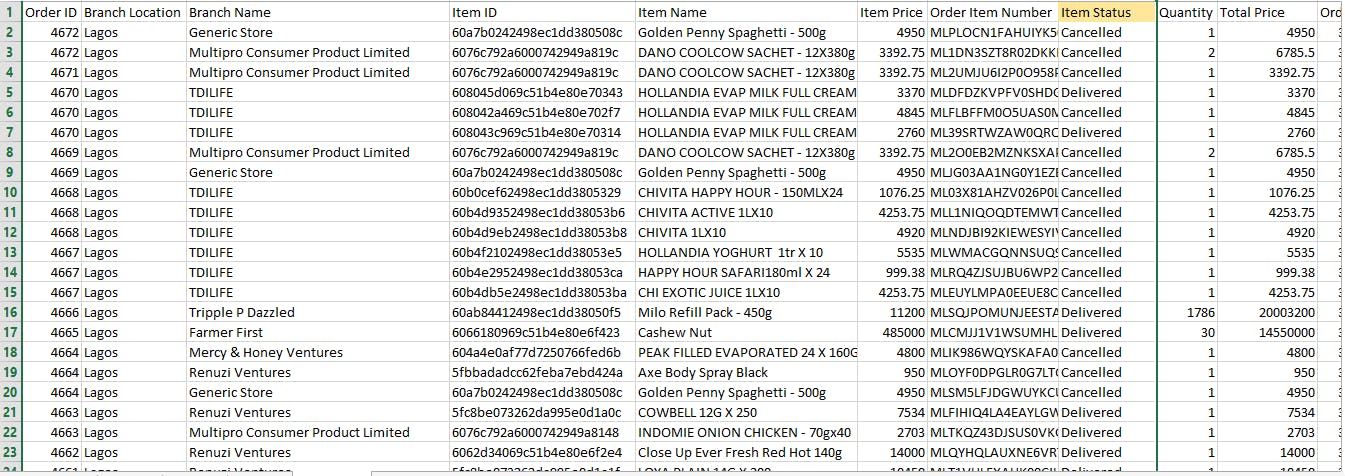
A view of cleaned Dataset.
Data Visualization TOOLS used: Power BI and Excel.
Visualization and insights generated of Dataset :
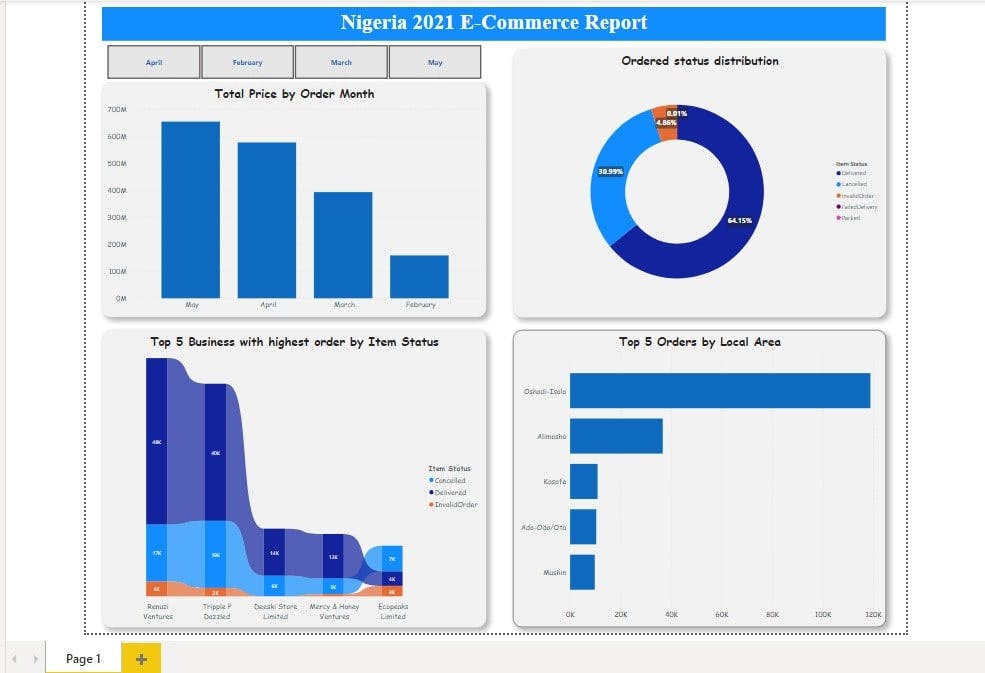
- Top 3 Businesses with Highest number of sales made.
From the analysis, Renuzi Ventures made the highest sales with a total of N387,313,524, while Tripple P Dazzled and Farmer first made the 2nd and 3rd positions respectively.
- Top 3 Products Ordered and successfully delivered.
The analysis showed that consumers ordered more of Milo Sachet 20g and Knorr ckicken for the period of 4months.
- Top 5 Local areas that has the most orders.
Consumers living in Oshodi-Isolo area of lagos made the most online order from the E-commerce platform.
- Items Status by Quantity.
65% of total items ordered were delivered to customers, 18% were invalid, while 17% of orders were canceled. view of our data
Our project is open for review and recomendation